

A multidisciplinary peer-reviewed journal bridging business, entrepreneurship, education, sustainability, finance, cultural studies, and media — from the Paris School of Entrepreneurship.
A peer-reviewed, open-access journal publishing rigorous scholarly work at the intersection of business, entrepreneurship, education, economics, finance, sustainability, artificial intelligence, cultural studies, and media & journalism.
IJABER brings together researchers, educators, policymakers, and industry leaders to advance knowledge on the forces reshaping economies, societies, institutions, and cultures — bridging academic excellence with real-world impact across every field it touches.
Strategy &
Sustainability
Table of Contents
Special Issue aligned with the PSE International Conference on Innovation, Strategy & Sustainability
pp. 5–14 03Designing for Behavioral Change: An Innovative Waste Bin System for Source Segregation in Primary School Settings
pp. 26–32 07Culture, Cultural Heritage, and the Sustainability Imperative: A Critical Assessment from Nigeria
pp. 97–104
pp. 16–24 04FinTech Adoption and Sustainable Development in Emerging Economies: An Empirical Investigation of Nigeria
pp. 34–55
pp. 57–70 06ESG Disclosure Dimensions and Firm Value in Emerging Economies: Panel Evidence from Nigerian Agriculture and Natural Resources Sectors
pp. 72–95
pp. 106–122
Inaugural Editorial Note
"Innovation without strategy is noise. Strategy without sustainability is short-sightedness. This journal exists at the intersection where all three converge."
It is with both intellectual pride and institutional commitment that we present the inaugural issue of the International Journal of Applied Business & Education Research (IJABER), a publication of the Paris School of Entrepreneurship.
This first issue is dedicated to the themes of our founding conference — Innovation, Strategy & Sustainability — and publishes eight peer-reviewed papers that collectively illuminate the complexity of these themes across a genuinely international range of geographic and sectoral contexts: from climate policy and macroeconomic dynamics in the European Union, to digital finance and entrepreneurship in West Africa; from ESG disclosure practices in listed emerging market firms, to the cultural heritage imperatives of communities navigating globalization; and from engineering innovation and international business strategy in the Mexican automotive sector, to the broader questions of sustainable industrial development connecting the Americas, Europe, and the Global South. This issue spans three continents — reflecting IJABER's genuinely global editorial commitment.
IJABER was founded on a clear conviction: that rigorous, applied, interdisciplinary research — grounded in real institutional and economic contexts — is indispensable to the challenges of our time. The journal's scope deliberately extends beyond business and economics to encompass education, cultural studies, media, and journalism — fields that shape the human context within which all economic and organizational life unfolds.
We extend our deepest gratitude to the contributing authors, peer reviewers, and editorial board members who have made this launch possible. IJABER is open to submissions on a rolling basis and welcomes contributions from researchers worldwide.
Prof. Rudolph Oates Jr, Editor-in-Chief
Eva Oates, Managing Editor
IJABER · Paris School of Entrepreneurship · Paris, France
Aims & Scope
- → Financial technology & digital inclusion
- → Corporate finance & ESG
- → Green finance & sustainable investment
- → Capital markets in emerging economies
- → Entrepreneurial finance & venture capital
- → Entrepreneurial intention & ecosystems
- → Innovation management & technology adoption
- → Family business & succession
- → Strategic planning & organizational agility
- → Social & inclusive entrepreneurship
- → Educational innovation & pedagogy
- → Entrepreneurship education
- → Cultural heritage & sustainable development
- → Identity, diversity & intercultural management
- → Higher education policy & access
- → Media economics & news industry transformation
- → AI and the future of journalism
- → Digital media & platform governance
- → Communication in organizational contexts
- → Media literacy & information ecosystems
Peer Review Process & Publication Ethics
Author, A. A., & Author, B. B. (2025). Title of article. International Journal of Applied Business & Education Research (IJABER), 1(1), pp–pp. https://doi.org/10.XXXXX/ijaber.v1i1.XXX
Editorial Board
Specialization: Governance & International Political Economy
Specialization: Business, International Cooperation & Sustainable Development
- Dr. Holly HargisParis School of Economics, Paris, France
IJABER is actively building its international editorial and advisory boards. Scholars interested in serving as reviewers or associate editors are encouraged to contact the editorial office.
2 Department of Economic Analysis, Universidad Nacional de Educación a Distancia (UNED), Barcelona
Correspondence: JuanAntonio.Torrents@upc.edu
Recently, it has been confirmed that carbon dioxide (CO₂), the main greenhouse gas, has been the basis of climate change for the last 540 million years, being the "dominant factor that controls global climate variations throughout the Phanerozoic." Furthermore, there is wide variation in temperatures that has occurred in the period evaluated, with differences of up to 25°C. In those 485 million years, average temperatures range from 11°C in the late Pleistocene (between 129,000 and 11,000 years ago) to 36°C in the Turonian (about 90 million years ago). This is a much larger oscillation than that identified so far in previous paleoclimatic studies in a climate change that is causing rapid global warming.
Currently, the planet's average temperature is around 16°C, which is in the lower part of the range of the current eon. However, the planet is now experiencing rapid global warming. The difference from previous climate changes of the last 500 million years is that this time, the increase in CO₂ concentrations in the air is motivated by human action. The main reason is the massive use of fossil fuels (coal, oil, and gas), which, when burned to produce energy, release carbon dioxide that ends up largely in the atmosphere. NASA confirms that global warming results when the atmosphere traps heat radiating from Earth toward space. However, the impact is different by sector worldwide; the main impact is in energy with 73.2% (17.5% energy use by construction activities, 16.25% by transport, and 24.2% by industry), followed by agriculture, forestry, and land use with 18.4%, and finally 5.2% for others and 3.2% for waste. It also differs in terms of countries, with China being responsible for 28% of CO₂, followed by the United States with 15% and 1% for Africa.
Other evidence of climate change is the increase of drylands — areas without water resources — and the degradation of land, soil erosion, wildfires, and dust and sandstorms. Now, around 46% of all land is made up of drylands, inhabited by approximately 3 billion people. This means around 40% of the world's population is at risk of these impacts. In addition, increasing and irreversible damage is being caused to all ecosystems, increasing animal migration rates and degradation of forest parks. In the long term, air pollution will have an important impact on citizens. According to the World Health Organization (WHO), global warming causes around 7 million deaths every year, and the impact is very important in children, who are at a higher risk of developing respiratory complications. Besides the physical impacts on citizens, climate change has contributed to the appearance of new concepts to address its negative consequences on mental health. Eco-anxiety, eco-guilt, and ecological grief are used to describe different impacts of climate change on people's psychological well-being.
Regarding the economy and business, there is a consensus that droughts, environmental degradation, and conflicts over resources affect a large proportion in developing countries. The 2015 Paris Conference (COP21) concluded with a formal agreement under the United Nations Framework Convention on Climate Change (UNFCC), where the nations made a formal commitment to prevent warming of more than 2°C (above pre-industrial temperature) by 2050. Consequently, companies are treating climate change as a strategic priority, since the climate emergency poses big risks, such as decreasing natural resources, but it could also create opportunities like competitive advantage and profitability if companies change their priorities. Therefore, companies are increasingly aware of their environmental impact and are creating strategies to transparently determine zero-emissions targets and how they will be achieved.
Following this approach, countries and companies have the target of Net Zero, which is the balance between greenhouse gas emissions and removal from the atmosphere to achieve a neutral effect from a global point of view. Therefore, substantial economic investments and changes in multiple sectors are required. A transition to renewable energies is necessary, such as solar and wind, and new alternatives such as green hydrogen. This leads us to the fact that maintaining the temperature and preventing its rise means renewing agricultural systems, transforming factories, replacing petrol and diesel vehicles with electric ones, and replacing most of the world's electric power plants powered by fossil fuels.
However, during the Covid-19 crisis, two phenomena were intertwined that harmed society in general and the economy in particular, generating non-linear effects that could cause significant losses. Disturbances in companies' production and citizens' consumption increased unemployment and reduced salaries; in the end, there was a decrease in society's well-being, which caused social conflicts.
The next aspect to consider, which affects the future of the planet, is how much global warming costs in economic terms. The NRDC (Natural Resources Defense Council) estimated the cost of climate change at $1.9 trillion at the end of this century in hurricane damage, buildings, energy costs, and water costs. To solve it, there may be an intermediate solution, namely mitigation, as mentioned above, to ensure that net greenhouse gas emissions are zero. However, during the Covid-19 crisis, economic activity stopped rapidly and caused a great recession, but emissions were only reduced by 8%. On the other hand, analyses and studies estimate that the Net Zero approach could cost between 2% and 6% of annual income.
Recently, at COP29 in Baku, Azerbaijan, the membership reached an agreement to raise $300 billion until 2035 for climate change. However, this amount seems impossibly low for mitigation, making it a likely path to a disastrous 3°C increase in global warming. One option currently being analysed is solar geoengineering to reduce global temperature. Its origin was the 1991 eruption of Mount Pinatubo (Philippines), which sent ash and smoke up to 35 km and caused significant deviation of solar heat, leading to a 0.7°C drop in temperature in some areas. However, this technology is not proven and could cause negative effects and distract from the main objective, which is the reduction of excess carbon in the atmosphere. Furthermore, this would only be a patch, since ocean acidification, deforestation, and agriculture would continue to deteriorate. It seems that the only viable way to decarbonise is to eliminate fossil fuels in favour of renewable energy. Already in 2021, the International Energy Agency established that to reach the goal of zero emissions by 2050, all investments in fossil fuels should be stopped. On the other hand, the percentage of energy generated by fossil fuels went from 80.3% in 2009 to 80.2% in 2019, and that of renewable energies went from 8.7% to 11.2% in the same period, which implies very slow progress. In 2020, according to the IMF, subsidies for fossil fuels reached $6 trillion, which represents 6.8% of GDP.
The study area is the 27 European Union countries from 2013 to 2023. It includes 448.8 million citizens, covers an area of 4 million km², and represents 14.8% of the global economy. In 2023, the European Union achieved an 8% net reduction in greenhouse emissions compared to the previous year, and they are 37% lower than in 1990. In the same period, GDP increased by 68%. This takes the EU on the path to achieve the objectives in 2030.
The analysis includes the following types of variables: (1) Countries: European Union countries (27 items); (2) Greenhouse Emissions (297 Items); (3) Population (297 items); (4) Gross domestic product GDP (297 items); (5) Energy (297 Items); Total: 1,118 items. Data sourced from Eurostat Database (2024) for greenhouse emissions, energy, GDP, and population.
A regression model with interactive terms can be represented using the following formula: Y = β₀ + β₁X₁ + β₂X₂ + β₃X₃ + … + βnXn, where X represents the interaction between independent variables and Y is a dependent variable. The SPSS program was applied to find the relationship between the reduction of greenhouse emissions, population, GDP, and energy. Combining this formula with a linear regression between greenhouse emissions and other variables yields: Greenhouse gas emissions in tonnes = β₁ Population + β₂ Energy + β₃ GDP (βN: Constant).
The Kaya indicator is a mathematical expression used to describe the relationship between factors that influence energy-related trends and carbon dioxide emissions released into the atmosphere. Where: F is global CO₂ emissions from human sources; P is global population; G is world GDP; E is global energy consumption; G/P is GDP per capita; E/G is the energy intensity of GDP; F/E is the emission intensity of energy. This expression has been adapted to the data of the European Union from 2013 to 2023.
| Parameter | Figure |
|---|---|
| R | 0.962 |
| R² | 0.925 |
| Correct R² | 0.924 |
| Error tip of estimation | 14,373.86 |
| Statistical changes: R² | 0.925 |
| Statistical changes in F | 1,206.80 |
| Variable | Mean | Standard Deviation | N |
|---|---|---|---|
| Greenhouse gas emissions | 37,721.25 | 52,264.24 | 297 |
| Population | 16,475,429.91 | 21,793,698.09 | 297 |
| Energy | 23,059.03 | 31,781.07 | 297 |
| GDP | 504,427.16 | 803,112.85 | 297 |
| Variable | GHG Emissions | Population | Energy | GDP |
|---|---|---|---|---|
| Greenhouse gas emissions | 1.000 | 0.959 | 0.923 | 0.870 |
| Population | 0.959 | 1.000 | 0.943 | 0.877 |
| Energy | 0.870 | 0.877 | 1.000 | 0.852 |
| GDP | 0.923 | 0.943 | 0.960 | 1.000 |
| Parameter | Figure |
|---|---|
| Predictor number | 3 |
| Standard R request | 0.955 |
| R² | 0.13 |
| Root squares mean error | 15,576 |
| Medium average percentage error | 24,786 |
| Medium average error | 8,324 |
| Bayesian information criteria | 19,422 |
| Ljung-Box Q (18) Statistics | 65,706 |
| Ljung-Box Q (18) DF | 17 |
In the regression model, standard R, R², and the correct R² show a good figure near 95%, indicating that there is a relationship between future greenhouse emissions and population, energy, and GDP. Furthermore, the statistical changes in R² also show that the data fit the regression model well. Finally, the statistical changes in F confirm the hypothesis, since the figure is higher than 2.5. Regarding the Pearson correlation, Table 3 shows a good correlation between all variables, with figures between 0.85 to 0.9.
Based on the analysis, the ARIMA model's predictor number is 3, which means in 3 years, the root means square error (RMSE; 15,576) is correct, having compared it with the average (24,786). Furthermore, the medium absolute percentage error and medium average error confirm the findings. The Bayesian information criterion (BIC), which estimates the likelihood that a model is predictive, is slightly higher than expected, but the Ljung-Box Q, which examines the autocorrelations of the residuals, is sufficient to confirm the idea of linear regression.
Regarding the Kaya indicator, it is observed that the Covid-19 crisis affected all variables equally, except the population — which remained constant during the years of analysis — from the end of December 2019 to mid-to-late 2021, when there is an evident recovery. However, this indicates that, starting at the end of 2022, the same situation as before the crisis returned. Therefore, there has not been much learning about climate change, since we are continuing the same trend as a few years ago. This is not a good lesson, since it indicates a short-term vision on the part of the states and their rulers.
- Judd, E. J., et al. (2024). A 485-million-year history of Earth's surface temperature. Science, 385(6715). https://doi.org/10.1126/science.adk3705
- IPCC. (2018). Summary for policymakers. In Global warming of 1.5°C. Cambridge University Press.
- NASA. (2024). The causes of climate change. https://science.nasa.gov/climate-change/causes
- Hannah, R., Rosado, P., & Roser, M. (2020). Breakdown of carbon dioxide, methane and nitrous oxide emissions by sector. OurWorldinData.org.
- Malhi, Y., et al. (2020). Climate change and ecosystems: Threats, opportunities and solutions. Philosophical Transactions of the Royal Society B, 375(1794).
- Cunsolo, A., & Ellis, N. R. (2018). Ecological grief as a mental health response to climate change-related loss. Nature Climate Change, 8(4), 275–281.
- UNFCCC. (2018). What is the Paris Agreement? https://unfccc.int
- Devi, S. (2024). Net Zero: A risk business. International Accountant, September/October 2024(137).
- Ranger, N., Mahul, O., & Monasterolo, I. (2021). Managing the financial risks of climate change and pandemics. One Earth, 4(10), 1375–1385.
- Nordhaus, W. D. (2021). The spirit of green. Princeton University Press.
- International Energy Agency. (2021). Pathway to Net-Zero Emissions by 2050. IEA Special Report.
- Georgieva, K. (2021). Remarks at the High-Level Dialogue on Energy, UNGA. IMF.
- Berkeley Earth. (2025). Global Temperature Report for 2024. https://berkeleyearth.org/global-temperature-report-for-2024/
- Kaya, Y., & Yokoburi, K. (1997). Environment, energy, and economy: Strategies for sustainability. United Nations University Press.
- European Commission, DG Climate Action. (2024). Climate Action Progress Report 2023. European Commission.
- Eurostat Database. (2024). Emission of greenhouse gases and air pollutants and energy.
- Eurostat Database. (2024). GDP, population.
Entrepreneurship is a primary driver of economic activity, development, and growth. It is a medium or vehicle for creating employment opportunities, thereby helping to reduce unemployment, promoting sustainable, viable innovative ideas and the socio-economic well-being of the people. Hence, entrepreneurship has been acknowledged as a means of generating economic gains. The economy is more sustainable when there are individuals who can integrate technical skills with business acumen. It usually entails inner courage, ambition, and the will to stand on one's own feet. Rapid changes brought on by a new phase of globalization, combined with a deteriorating Nigerian and global economy, have reduced recruitment and significantly altered employment opportunities in many of the traditional sectors that previously absorbed the majority of young people and university graduates.
Graduate students in Nigeria are more likely than ever before to see the potential of creating their own businesses as a positive rather than a secondary career choice. However, numerous factors influence the amount to which students are inclined to do so and the opportunity for them to acquire critical qualities competences depending on their entrepreneurial intentions. Fatoki (2014) defines entrepreneurship as the ability and desire to take on the invention, organisation, and administration of a profitable endeavor, with all its dangers, in exchange for a profit. An "entrepreneur" is a person who starts a business, identifies an opportunity, pursues it, establishes and manages a business enterprise for the principal purpose of profit and growth.
Entrepreneurship intention means the starting point of an entrepreneurial action as intention comes before entrepreneurial activities. Entrepreneurial intention refers to an individual's intention to choose to be an entrepreneur for his or her profession or career. Entrepreneurial intention therefore leads to entrepreneurial actions and the entrepreneurship program are planned in order to inculcate positively an entrepreneurial intention and also impact in individuals both the required skills and knowledge. Bird (1988) in his study discovers that students tend to exhibit intense entrepreneurial attitudes and intentions compared to those who abscond from entrepreneurship programs.
Financial capital is the aggregate sum of money possessed and maintained by individual. Nosková & Peráček (2019) assert that financial accessibility implies having access to finance, particularly cheap funds, information and knowledge for investment motives. Financial accessibility involves the provision and usage of different affordable financial services. Stuetzer et al. (2014) assert that financial accessibility is continuously cost effective and a significant financial service for the deprived populace in order to grow a business. Large enterprises are not favoured towards government policies while the small businesses are also struck with challenges related to growing as a result of inaccessibility to finance.
Self-reliance is related to self-sufficiency. It connotes handling things for oneself instead of someone else doing it for us. Self-reliance has to do with perceptive insight in efforts and ability to recognize, use and manage smoothly both personal and collective resources, natural or human in the immediate environments in order to upgrade people's life and standard of living (Olayiwola, 2012). Entrepreneurship intention has been observed as an approach to decrease the rate of unemployment and maintain a high standard of living in developing countries. The Nigerian labour market is often characterized by wage differences between the wage-employment sector (private-public sector) and self-employment. Fluctuation in labour market is a typical example of a fast changing factor. Some of the small and medium enterprises in Nigeria's economy are folding up due to demotivation to the entrepreneurs by government policy and many environmental factors.
The following research questions guided this study: (1) What is the direction and strength of relationship among financial accessibility, labour-market condition, self-reliant propensity and entrepreneurship intention among University of Ibadan postgraduate students? (2) To what extent will financial accessibility, labour-market condition and self-reliant propensity predict entrepreneurship intentions among University of Ibadan postgraduate students? (3) What are the relative contributions of financial accessibility, labour-market condition and self-reliant propensity to the prediction of entrepreneurship intention among University of Ibadan postgraduate students?
The study was anchored to Constructivism and Theory of Planned Behaviour while non experimental design of correlational research type was adopted. The population of the study comprised all postgraduate students of the University of Ibadan. Multi-stage sampling procedure was adopted in selecting the sample for the study. University of Ibadan was clustered along fifteen faculties. Simple random sampling technique was used to select three faculties, four departments each per faculty and 25 postgraduate students per department respectively. In all, a total of three faculties, 12 departments and 300 postgraduate students participated in the study.
Two instruments were developed and validated, namely: Financial Accessibility, Labour-market Condition and Self-reliant Questionnaire (FALCSQ) which elicited responses on three constructs: Financial Accessibility (10 items), Labour-market Condition (10 items) and Self-reliant Questionnaire (10 items). The reliability of this instrument was established using Cronbach Alpha and r=0.81. The second instrument was the Entrepreneurship Intention Questionnaire (EIQ) with 10 items and r=0.87. Data were analysed using Pearson Moment Product Correlation and Multiple regression at 0.05 level of significance.
Research Question One: What is the direction and strength of relationship among financial accessibility, labour-market condition, self-reliant propensity and entrepreneurship intention among University of Ibadan postgraduate students?
| Variables | Financial Accessibility | Labour-Market Condition | Self-Reliant Propensity | Entrepreneurship Intention |
|---|---|---|---|---|
| Financial Accessibility | 1 | |||
| Labour-Market Condition | 0.419** | 1 | ||
| Self-Reliant Propensity | 0.310** | 0.361** | 1 | |
| Entrepreneurship Intention | 0.202** | 0.189** | 0.565** | 1 |
Table 1 revealed that significant low positive correlations exist between financial accessibility and entrepreneurship intention (r = 0.20, P < .05); between labour-market condition and entrepreneurship intention (r = 0.19, P < .05); between self-reliant propensity and entrepreneurship intention (r = 0.565, P < .05). This implies that there are significant relationships among all three predictors and entrepreneurship intention.
Research Question Two: To what extent will financial accessibility, labour-market condition and self-reliant propensity predict entrepreneurship intention?
| Multiple R = 0.567 · R Square = 0.321 · Adjusted R Square = 0.314 · Standard Error = 4.375 | ||||
|---|---|---|---|---|
| Source of Variance | Sum of Square | Df | Mean Square F | Sig. |
| Regression | 2,681.77 | 3 | 893.92 | |
| Residual | 5,666.22 | 296 | 19.14 · 46.69 | .000 |
| Total | 8,347.99 | 299 | ||
Table 2 indicates that there is joint influence between the independent variables (F(3, 296) = 46.69; R = 0.567, R² = 0.321; p < 0.05). The adjusted R² = 0.314 shows that independent variables accounted for 31% of the total variance in entrepreneurship intention while the remaining 69% may be due to other factors not investigated in the study model.
Research Question Three: What are the relative contributions of financial accessibility, labour-market condition and self-reliant propensity to the prediction of entrepreneurship intention?
| Model | B | Std. Error | Beta | t | Sig. |
|---|---|---|---|---|---|
| (Constant) | 6.812 | 1.763 | 3.863 | .000 | |
| Financial Accessibility | 0.054 | .073 | 0.040 | 0.739 | .460 |
| Labour Market Condition | 0.048 | .083 | 0.032 | 0.579 | .563 |
| Self-Reliant | 0.595 | .055 | 0.565 | 10.798 | .000 |
Table 3 indicates that there is a significant relative contribution of self-reliance to entrepreneurship intention (β = 0.565; t = 10.798; p < 0.05), contributing significantly 56.5% independently. However, financial accessibility (β = 0.040; t = 0.739; p > 0.05) and labour market condition (β = 0.032; t = 0.579; p > 0.05) did not relate significantly to entrepreneurship intention.
Based on the findings, it could be concluded that there is a significant high correlation between self-reliant propensity and entrepreneurship intention among the sampled postgraduate students in University of Ibadan. The finding aligns with the assertion of Lange (2012) that the idea of self-reliance to an entrepreneur may be a leeway to his or her inbuilt character and may express the fundamental thought process. It is noted that individuals who are self-employed are more satisfied because of the freedom they enjoy managing their business affairs.
The findings also show that a low positive significant relationship exists between financial accessibility and entrepreneurship intention. The findings appear in this manner because capital is very paramount in the establishment of a business, at least to secure start-up equipment and purchase of necessary materials. Kerr & Nanda (2009) confirm that being self-employed depends on possessing both entrepreneurial vision and having access to the required financial resources to implement it. Ayyagari (2016) emphasised that insufficient financial resources is a significant challenge when launching a new business for further growth while Idowu (2010) recognised credit accessibility facilities as an important factor responsible for small start-ups success factors in their bid to build productive capacity, compete, and ideate business and to reduce poverty level in developing countries.
On the contrary, the findings reveal a low positive significant relationship between labour-market conditions and entrepreneurship intentions. The result came out in this manner because people at times do not pay attention to the Labour Market condition impact on entrepreneurship intentions. The business skills of entrepreneurs make business more successful and may lead towards sustainable competitive advantage as well. Two entrepreneurial characteristics determine business success: psychological factors and education experience. Higher education is considered to have better impact in entrepreneurship because it reflects the fact that they are on average more capable.
Based on the findings of the study, it is concluded that there are positive significant associations among financial accessibility, labour-market condition, self-reliant propensity and entrepreneurship intention among University of Ibadan postgraduate students. The findings necessitate further investigations into the predictors of entrepreneurship intention in the Nigerian economy at large. Therefore, it is recommended that: (1) Government should formulate a policy that will make available funds to be accessed by postgraduate students for the establishment of Businesses that will empower and make them self-reliant. (2) Graduates should be willing to establish their personal business and become employers of labour, instead of job seekers. (3) The economy stakeholders should create an enabling environment that will engender new business. (4) Graduates should devise a means to source for business capital either through personal savings or bequeathed wealth in order to be self-reliant.
- Ayyagari, M. (2016). What determines entrepreneurial outcomes in emerging markets? Review of Financial Studies.
- Bird, B. (1988). Implementing entrepreneurial ideas: The case for intention. Academy of Management Review, 13(3), 442–453.
- Fatoki, O. (2014). The Entrepreneurial Intention of Undergraduate Students in South Africa. Mediterranean Journal of Social Sciences.
- Gilenko, E., & Chernova, A. (2021). Saving behaviour and financial literacy of Russian high school students. Child. Youth Serv. Rev. 127, 106–122.
- Kerr, W., & Nanda, R. (2009). Financing Constraints and Entrepreneurship. Handbook of Research on Innovation and Entrepreneurship.
- Kim, E., & Yoon, S. (2021). Social capital, user motivation, and collaborative consumption. Journal of Retailing and Consumer Services, 62, 102651.
- Kummitha, H. R., & Kummitha, R. K. R. (2021). Sustainable entrepreneurship training. International Journal of Management Education, 19, 100449.
- Lange, T. (2012). Job satisfaction and self-employment: Autonomy or personality? Small Business Economics, 38(2), 165–177.
- Mukhtar, S., Gwazawa, U. G., & Jega, A. M. (2018). Entrepreneurship development for diversification of the Nigerian economy. Journal of Economics, Management and Trade, 21(6), 1–11.
- Nosková, M., & Peráček, T. (2019). Termination of employment in the Slovak Republic. Central European Journal of Labour Law and Personnel Management, 2(2), 44–59.
- Ogwumike, F., Alaba, O., & Alayande, B. (2006). Labour force participation, earnings and inequality in Nigeria. African Economic Research Consortium.
- Olayiwola, A. O. (2012). Social Science Education for Self-Reliance. Journal of Education and Leadership Development, 4, 13–18.
- Patzelt, H., & Shepherd, D. A. (2011). Recognizing opportunities for sustainable development. Entrepreneur. Theor. Pract. 35(4), 631–652.
- Schaper, M., Volery, T., Weber, P., & Lewis, K. (2011). Entrepreneurship and Small Business (3rd Asia Pacific ed.). John Wiley & Sons.
- Snieska, V., et al. (2020). Fundamental Human Resource Management Practices. Transformations in Business and Economics, 19(2).
- Stuetzer, M., et al. (2014). Regional characteristics, opportunity perception and entrepreneurial activities. Small Business Economics, 42, 221–244.
2 Department of Computer Engineering, Yaba College of Technology, Yaba, Lagos, Nigeria — adebayo.adebari@yabatech.edu.ng
Nigeria faces a growing solid waste crisis due to a lack of modern waste management technologies. The country generates 32 million tonnes of waste annually, with plastic waste a significant concern. Nigeria's rapidly growing cities, fueled by high population and urbanization rates, struggle with solid waste management due to weak infrastructure and limited waste segregation. This is particularly concerning as proper waste management is crucial for a developing nation. Daily waste generation per person is high and the country is projected to reach a staggering 107 million tonnes by 2050.
Most developed countries have established a comprehensive program for sorting waste at source and recycling useful waste. In contrast, municipal solid waste (MSW) is still indiscriminately disposed of in Nigeria, leading to blockage of canals, and drainages and causing pollution to water bodies. Nigeria's waste management challenges require effective solutions that involve proper collection and sorting at the source. MSW sorting requires the use of smart waste sorting equipment such as smart recycling bins. Recycling averts huge volumes of solid waste disposed at landfill sites, gives employment opportunities, decreases emissions to the environment, abates waste management costs by creating revenue, and saves resources. Studies have shown that recycled bins with designated slots for recyclables influence user behavior, thereby enhancing better waste sorting habits and separation efficiency. In many schools in Nigeria, single waste bins are still provided whereby wastes are mixed and disposed at available dumpsites.
The research was conducted at the University of Lagos Staff School, a primary school in Akoka, Nigeria. It was established at the University of Lagos, one of Nigeria's foremost Universities, in 1966. The school has a creche, nursery, and primary sections. As at the time of the study, there are about 1,000 pupils in the school. The school manages its waste through the employment of cleaners who are in charge of daily sweeping of the classrooms and the school environment. Classrooms are cleaned from Monday to Friday in the mornings by 7:00 am and in the afternoons by 3:00 pm. Waste generated is comingled and collected in single waste bins placed both inside and outside the classrooms. Waste is thereafter taken to containers placed outside the school premises. The private waste companies in charge of waste management in the University community collect the waste and transfer it to the University's recycling center. Waste is sorted for recyclables manually. However, only 1% of waste materials are recovered at the recycling center, the rest is landfilled.
The designed bins were constructed with paper cardboard and plywood. Paper cardboard was obtained from one of the supermarkets in the university community while plywood was obtained from a market in Yaba, Lagos. The bin was layered with plywood and divided into three multiple compartments for efficient separation of waste types. Each compartment was made of paper cardboard. The bins were coloured to enhance the easy identification of waste bins and further influence the students' recycling behaviour. In addition, waste types were illustrated with letter labels and visuals. A total of 120 Grade 5 pupils participated in the study. Waste bins were placed in the classrooms where students could easily access them. Waste collection and analysis commenced by 3:00 pm at the end of the school day. We also tested the utility of the designed bin with the traditional bins used in the school. The quantification and characterization of waste were carried out for two consecutive weeks (Monday to Friday) in July 2024. The sampling method involved direct sampling of waste from bins, where waste was manually sorted, classified, and weighed.
The percentage composition by weight of waste fractions for both bins showed organic waste content for both bins at 46% and 43% (designed and single waste bins) respectively. The percentage composition of recyclable materials such as nylons and paper was high for the single waste bins (57%) and newly designed bins (54%), though with little variations in paper composition. The percentage of organic waste and recyclables presented in this study is higher than those reported by Jiang et al. for a primary school in Italy. Organic waste fraction from the food canteen present in the school was not accounted for. The high percentage of organic waste from the present study is mainly from the consumption of food, snacks, and fruits by the pupils.
Waste generated in grams by the pupils with the use of both bins showed that the quantities of waste generated by the designed bin (9,680 g) were higher compared to the single waste bins (7,440 g). Organic waste had the highest amount of waste, followed by nylon and paper in the newly designed bins. 4,400 g of organic waste was generated, followed by 2,830 g of nylon and 2,450 g of paper respectively. This further showed greater recycling compliance by the pupils with the use of recycled bins.
| Waste Type | Designed Bin (g) | Traditional Bin (g) |
|---|---|---|
| Organic | 4,400 | 3,190 |
| Paper | 2,450 | 2,010 |
| Nylon | 2,830 | 2,240 |
| Total | 9,680 | 7,440 |
The results revealed that the recycling potential of waste components increased when waste was separated from the source. It was further emphasized that recycling containers promote the separation of recyclable materials from non-recyclables which reduces contamination in recycling streams. In contrast to the conventional bin, where waste had to be sorted individually and thereafter weighed into individual components, the recycled bin allowed students to sort their waste directly from the source into respective waste types, thereby saving time. This study revealed that the attitude of the children towards waste recycling changed. The introduction of waste bins with colors and visuals attracted the children thereby influencing their attitude towards waste management. This study corroborates findings that well-designed waste bins produce positive behavioral outcomes towards recycling in public settings.
The innovative bins, with their clear signage and compartments, led to higher waste generation, particularly in recyclable materials. The provision of adequate and well-designed recycling bins in primary school settings enhanced the understanding of proper waste management practices among children. This study was unique in its promotion of sustainable waste management using recycled waste materials in waste bin design. The study recommends that waste management practices in educational institutions can significantly improve with innovative, user-friendly waste bins with distinct compartments, and that similar behavioral design approaches be scaled across Nigerian public schools.
- Babayemi, J. O., & Dauda, K. T. (2009). Evaluation of solid waste generation, categories and disposal options in developing countries. Journal of Applied Sciences and Environmental Management, 13(3), 83–88.
- Dataphyte. (2023). Waste crisis in Nigeria: A detailed report. https://www.dataphyte.com
- World Bank. (2018). What a waste: A global review of solid waste management. World Bank Publications.
- Adeniran, A. E., Nubi, A. T., & Adelopo, A. O. (2017). Solid waste generation and characterization in the University of Lagos. Waste Management, 67, 3–10.
- Duffy, S., & Verges, M. (2009). It matters a whole lot: Perceptual affordances of waste containers influence recycling compliance. Environment and Behavior, 41(5), 741–749.
- Jiang, Q., et al. (2021). Perceptive preference toward recycling bin designs. Waste Management, 127, 130–140.
- Mbama, C. A., et al. (2023). Solid waste recycling within higher education in developing countries: A case study of the University of Lagos. Journal of Material Cycles and Waste Management, 25(2), 886–898.
- Kuffour, R. A. (2020). Possibility of improving solid waste management in senior high schools in the Ashanti region of Ghana. African Journal of Environmental Science and Technology, 14(8), 231–240.
- Rada, E. C., et al. (2016). Analysis and measures to improve waste management in schools. Sustainability, 8(9), 840.
2 Department of Accounting, Babcock University, Ilishan-Remo, Ogun State, Nigeria
Access to technology has expanded the availability of financial services, including online and mobile banking, digital credit for unbanked populations, and innovative solutions like WhatsApp fundraising and money pooling through platforms such as M-Pesa. M-Pesa, a low-cost mobile service enabling users to deposit, withdraw, or transfer money seamlessly, has been particularly impactful in Kenya. Research by Suri and Jack (2016) indicates that M-Pesa lifted 2% of Kenyan households out of extreme poverty. The service's ability to penetrate rural areas has proven especially effective, offering cost-efficient and secure financial transaction methods in sectors like agriculture, benefiting smallholder farmers.
Sustainable development is a multifaceted concept that integrates economic growth, social inclusion, and environmental sustainability. This study focuses on economic growth, specifically measured by Gross Domestic Product (GDP) growth, as a critical indicator of sustainable development. For Nigeria, harnessing innovative financial technologies to drive GDP growth is vital to achieving its development goals and improving the overall welfare of its citizens. Sustainable economic growth involves meeting present needs without jeopardizing the ability of future generations to meet their own. As nations strive to achieve the United Nations SDGs, innovative financial products play a key role in financing sustainable projects, supporting small and medium-sized enterprises (SMEs), and encouraging responsible production and consumption patterns.
FinTech has become one of the fastest-growing technology sectors, with innovations spanning banking, cryptocurrencies, blockchain, artificial intelligence, big data, and beyond. The rise of financial technologies such as mobile banking, blockchain, peer-to-peer lending, and digital payments has reshaped the global financial ecosystem. FinTech has played a pivotal role in improving financial inclusion, reducing transaction costs, and enhancing service efficiency. According to the World Bank, although 1.7 billion adults globally remain unbanked, two-thirds of them own mobile phones, which could facilitate access to financial services. In Nigeria, the fintech revolution is transforming the financial sector. Despite around 36.8 million Nigerian adults being financially excluded, fintech solutions are narrowing this gap by offering affordable and accessible financial services. Mobile money platforms, such as Paga and Opay, have revolutionized financial transactions in Nigeria, boosting economic activity and financial inclusion.
Innovative financial technologies (FinTech) have emerged as transformative forces driving financial inclusion, economic efficiency, and sustainable development globally. FinTech encompasses both green finance and digital finance. Green financial technologies aim to promote environmental sustainability by facilitating investments in renewable energy, energy efficiency, and sustainable projects. Conversely, digital finance emphasizes financial inclusion through digital payment platforms and mobile banking solutions. The United Nations (2015) identifies financial inclusion as a key driver for achieving SDGs, including poverty reduction, gender equality, and economic growth. FinTech bridges gaps in financial access by leveraging innovative technologies to provide financial services to underserved populations, particularly in rural areas.
Sustainable development is founded on three core dimensions: economic, social, and environmental. It emphasizes a holistic approach, addressing not only environmental concerns but also economic growth and social well-being. The relationship between finance and sustainable development is critical. Financial systems play a pivotal role in mobilizing resources, channelling capital, and supporting investments in initiatives aligned with sustainability goals. Financial institutions, including banks, investment firms, and insurance companies, can design specific instruments like green bonds and impact investment funds that enable investors to support environmentally and socially responsible projects while also generating financial returns. Additionally, integrating ESG criteria into investment strategies has become increasingly significant.
Resource Dependency Theory (RDT): Propounded by Jeffrey Pfeffer and Gerald Salancik in 1978, RDT emphasizes how organizations depend on external resources for survival and success. The theory is particularly relevant in understanding how the adoption of innovative financial technologies can drive sustainable development in Nigeria. Fintech solutions help small and medium-sized enterprises (SMEs) access credit, improve operational efficiency, and contribute to GDP growth. In Nigeria, resource dependency on traditional financial systems has limited financial inclusion and access to capital, especially for underserved populations. Fintech innovations provide an alternative means of accessing financial resources, thereby reducing dependency on conventional banking systems.
Technology Acceptance Model (TAM): Developed by Fred Davis in 1986, TAM identifies two primary factors that influence technology adoption: Perceived Usefulness (PU) and Perceived Ease of Use (PEOU). In Nigeria, poor digital literacy, lack of trust in technology, regulatory challenges, and inadequate digital infrastructure can negatively impact users' perceptions of fintech solutions. The TAM further explains that the behavioral intention to adopt fintech solutions translates into actual use when users perceive significant benefits. For instance, small and medium-sized enterprises (SMEs) in Nigeria are more likely to use digital lending platforms if they find them useful in accessing funds and reducing bureaucratic hurdles.
This study employed a quantitative research design, specifically a correlational research approach. Data was collected from a variety of sources, including the Central Bank of Nigeria (CBN), Global FinTech Index and World Bank Data Analysis. The collected data were analyzed using statistical techniques, including Descriptive Statistics, Correlation Analysis and Regression Analysis. The population of the study consists of the African Countries. Nevertheless, this study purposively selects Nigeria being the largest economy in Africa. The study covers the period 2011 to 2021.
The model for the study is specified in functional form: GDPRit = β0it + β1IFTit + εit. Where: GDPR connotes Gross Domestic Growth rate; IFT denotes Innovative Financial Technology measured using Number of fintech users in the country; β0 represents constant; β1 signifies coefficient of explanatory variables; ε stands for standard error; i denotes companies; t represents time.
The minimum value of FinTech adoption is recorded as 0%, indicating that at some point during the observation period, certain populations had no access to FinTech services. The maximum percentage of FinTech users reaches 37%, demonstrating notable progress. The mean value of 23.97% suggests that, on average, nearly a quarter of the population has embraced FinTech services. The standard deviation of 15.7% indicates considerable variation in the level of FinTech adoption. The descriptive statistics for GDP growth present a dynamic picture. The minimum GDP growth rate stands at –1.79%, reflecting economic contraction, while the maximum GDP growth rate is 6.67%. The mean GDP growth rate of 2.76% suggests modest economic progress. The standard deviation of 2.86% reveals moderate variability in GDP growth rates.
The Pearson Correlation Coefficient between the percentage of the population using FinTech services and GDP growth rate is –0.530. This value indicates a moderate negative correlation between the two variables. As the percentage of FinTech users increases, GDP growth tends to decrease, and vice versa. The negative correlation challenges conventional assumptions that increased FinTech adoption universally drives economic growth. While financial technology innovations are generally expected to improve financial inclusion, facilitate access to credit, and enhance economic productivity, this result highlights complexities in the relationship. The correlation analysis reveals a moderate negative relationship (–0.530) between the percentage of FinTech users and GDP growth, though the relationship is not statistically significant (p = 0.094).
| Model Summary | Value |
|---|---|
| R | 0.530 |
| R-Square | 0.281 |
| F-statistic | 3.512 |
| Sig. | 0.094 |
| Constant (β₀) | 5.076 (p = 0.007) |
| IFT Coefficient (β₁) | –0.097 (p = 0.094) |
The R-Square value of 0.281 reveals that approximately 28.1% of the variation in GDP growth rate is explained by the percentage of the population using FinTech services. The ANOVA table's F-statistic of 3.512 and the associated p-value of 0.094 indicate that the regression model is not statistically significant at the 5% level (p > 0.05). The unstandardized coefficient for the percentage of FinTech users is –0.097, indicating that for every 1% increase in the percentage of the population using FinTech services, GDP growth decreases by approximately 0.097 percentage points.
The relationship between FinTech adoption and GDP growth is negative but statistically insignificant, indicating that increased FinTech usage has not yet translated into measurable economic growth. FinTech adoption explains only a moderate proportion (28.1%) of GDP growth variability, highlighting the need to consider other economic and institutional factors that influence sustainable development. Policymakers should focus on improving internet access, digital infrastructure, and financial education, especially in underserved regions, to enhance the effective utilization of FinTech services and drive economic growth. Since FinTech adoption alone cannot comprehensively explain GDP growth, future studies and policy frameworks should account for additional determinants of sustainable development, including government investments, inflation rates, employment levels, and capital formation.
This study contributes to the growing body of literature on the nexus between financial technology (FinTech) adoption and sustainable economic development, particularly within the context of emerging economies. The findings underscore that, while FinTech adoption is growing, its economic impact remains statistically insignificant, signaling a need for further exploration of the mechanisms linking FinTech adoption to macroeconomic outcomes. The study emphasizes structural impediments, such as inadequate digital infrastructure, financial illiteracy, and regulatory challenges, as potential barriers to the effective realization of FinTech's economic benefits.
- Beck, T., Chen, T., Lin, C., & Song, F. (2016). Financial innovation: The bright and the dark sides. Journal of Banking & Finance, 72, 28–51.
- Christina, A., & Anthony, A. I. (2023). Financial Outreach, Financial Innovation and Sustainable Development in Africa. Environmental Science and Pollution Research.
- Davis, F. D. (1989). Perceived usefulness, perceived ease of use, and user acceptance of information technology. MIS Quarterly, 13(3), 319–340.
- Demirguc-Kunt, A., Klapper, L., Singer, D., Ansar, S., & Hess, J. (2018). The Global Findex Database 2017. The World Bank.
- EFInA. (2020). Key Findings: EFInA Access to Financial Services in Nigeria 2020 Survey.
- Gomber, P., Koch, J.-A., & Siering, M. (2017). Digital Finance and FinTech: Current research and future research directions. Journal of Business Economics, 87(5), 537–580.
- Haider, H. (2018). Innovative financial technologies to support livelihoods and economic outcomes. K4D Helpdesk Report. Institute of Development Studies.
- Jack, W., & Suri, T. (2016). The long-run poverty and gender impacts of mobile money. Science, 354(6317), 1288–1292.
- Morshadul, H., Ariful, H., Mohammad, Z. A., & Dominic, G. (2024). FinTech and sustainable development: A systematic thematic analysis. International Review of Financial Analysis, 95, 103.
- Mothobi, O., & Grzybowski, L. (2017). Infrastructure deficiencies and adoption of mobile money in Sub-Saharan Africa. Information Economics and Policy, 40, 71–79.
- Nwafor, C. E., & Yomi, B. O. (2021). Financial inclusion and economic growth in Nigeria. International Journal of Financial Studies, 9(3), 52–65.
- Ozili, P. K. (2018). Impact of digital finance on financial inclusion and stability. Borsa Istanbul Review, 18(4), 329–340.
- Pfeffer, J., & Salancik, G. R. (1978). The External Control of Organizations: A Resource Dependence Perspective. Harper & Row.
- Rabab'ah, M. M. (2024). The impact of green financial technology on sustainable development: A case study of Europe. Seybold Report Journal, 19(01), 88–103.
- Sahay, R., et al. (2020). Financial inclusion: Can it meet multiple macroeconomic goals? IMF Staff Discussion Note SDN/15/17.
- United Nations. (2015). Transforming our world: The 2030 Agenda for Sustainable Development. United Nations.
- Venkatesh, V., & Davis, F. D. (2000). A theoretical extension of the Technology Acceptance Model. Management Science, 46(2), 186–204.
- World Bank. (2021). Nigeria Development Update: Resilience through Reforms. World Bank Group.
- Yubo, X., Muxi, L., & Lu, W. (2024). Impact of green digital finance on sustainable development: evidence from China's pilot zones. Financial Innovation, 10(10).
2 Dept. of Business Administration, Lagos State University of Science of Technology — alawal@pau.edu.ng · ORCID: 0000-0001-6285-6304
4 Dept. of Office Technology and Management, Federal College of Education (Technical), Akoka, Lagos — nadebakin86@gmail.com · ORCID: 0009-0001-6599-1656
One of the fundamental pillars of the world economy is family-owned companies which represent a significant proportion of private businesses and foster innovation, employment, and economic growth in the long run. In Nigeria, these businesses have an even higher significance, as they control the private sector and contribute immensely to the country's GDP through local enterprise development and employment generation. Some of these companies benefit from the strong bonds and trust often found in families, which help improve the decision-making processes and management of resources. A more expansive view of sustainability should include the long-term strategic planning and economic adaptability of the family business (Lumpkin & Brigham, 2011). The absence of innovation, business planning, and strategic foresight account for one of the major challenges these companies face in their efforts to remain sustainable.
Most studies done on family-owned businesses investigate the problem of gaps in the intergenerational transition but few look into the impact such transition have on the adoption of salient strategic practices. This study bridges this gap by exploring the influence of various generations (e.g. founder, second generation) on the adoption of multifaceted strategic practices, including innovation, business agility, and planning. By utilizing these different practices for long-term sustainable development, the study aims to provide crucial information that enables family-owned businesses in Nigeria to go through successful generational transitions without losing their competitive edge.
H1: Generational stages significantly influence the adoption of strategic practices in family-owned businesses. H2: Strategic practices, such as innovation, planning, competitive intelligence, and agility, significantly contribute to sustainability in family-owned businesses. H3: There is a significant relationship between generational stages, strategic practices, and sustainability, with strategic practices mediating the impact of generational maturity on sustainability. H4: Generational ownership positively moderates the relationship between strategic planning and sustainability, such that later-generation family-owned businesses exhibit a stronger alignment between strategic planning practices and sustainable outcomes.
This study investigates the relationship between family businesses, their generations, and their critical strategic choices within family enterprises. This research draws on two theoretical perspectives: the Resource-Based View (RBV) and the Dynamic Capabilities Framework. The RBV looks at family firms as competing businesses and focuses on specific resources such as family connections and entrepreneurial legacy as major contributors to the firm's success (Barney, 1991). The Dynamic Capabilities Framework views adaptation to environmental conditions as the primary source of innovation and considers the rearrangement of resources as a fundamental activity (Teece, Pisano and Shuen, 1997).
Family enterprises have gone through substantial changes over the years. First-generation family businesses are usually structured around the vision of the founder, although there is usually little to no formal organization and a clear succession plan. Second-generation businesses are more organized in governance, but they seek innovation while balancing the founders' legacy. The third-generation family business, which enjoys the benefits of experience, faces issues of stakeholder disagreements and a weakened family grip. Several strategic initiatives are crucial for the sustainability of family businesses. Competitive intelligence (CI), involving systematic market analysis, enables businesses to anticipate changes and adapt successfully. Business agility, the ability to respond swiftly to market shifts, is vital for long-term success. Strategic planning, a key driver of sustainability, integrates business objectives with market realities and ensures intergenerational continuity.
This study employed a descriptive and correlational research design. Data was collected from 237 respondents across 25 businesses registered with the Manufacturers Association of Nigeria (MAN), spanning various sectors and including businesses of different sizes and generational stages. Data collection involved structured questionnaires assessing demographic details, strategic practices (competitive intelligence, innovation, agility, planning), and sustainability indicators. Data analysis included descriptive statistics, correlation analysis, regression analysis, and ANOVA. The study adhered to ethical considerations, ensuring data confidentiality and participant consent.
The majority of businesses in this study are medium-sized (39.2%), primarily operating in the automobile and manufacturing sectors (37.1% and 33.3%, respectively). Most of the businesses have been in operation for over 20 years (76.4%), and more than half are founder-led, representing the first generation (53.6%).
| Variable | Mean | SD | 1 | 2 | 3 | 4 | 5 | 6 |
|---|---|---|---|---|---|---|---|---|
| 1. Generation of Family Business | 1.65 | 0.771 | 1 | -.029 | -.017 | .031 | .043 | -.128 |
| 2. Competitive Intelligence | 3.46 | 0.507 | 1 | 0.541 | 0.630 | 0.675 | 0.351 | |
| 3. Business Agility | 3.43 | 0.577 | 1 | 0.632 | 0.730 | 0.356 | ||
| 4. Innovation | 13.58 | 2.031 | 1 | 0.674 | 0.361 | |||
| 5. Strategic Planning | 13.42 | 2.358 | 1 | 0.452 | ||||
| 6. Sustainability | 13.32 | 2.529 | 1 |
| Model | R | R Square | Adjusted R Square | Std. Error of the Estimate |
|---|---|---|---|---|
| 1 | 0.460 | 0.212 | 0.198 | 2.265 |
| Model | B | Std. Error | Beta | t | Sig. |
|---|---|---|---|---|---|
| (Constant) | 5.707 | 1.138 | 5.015 | ||
| Competitive Intelligence | 0.286 | 0.416 | 0.057 | 0.687 | |
| Business Agility | 0.119 | 0.389 | 0.027 | 0.306 | |
| Innovation | 0.097 | 0.108 | 0.078 | 0.900 | |
| Strategic Planning & Risk Management | 0.365 | 0.108 | 0.341 | 3.388 | p < 0.05 |
| Variable | Generational Stage | Mean | SD | F | p |
|---|---|---|---|---|---|
| Innovation | First Generation | 12.9 | 2.4 | 5.31 | 0.006 |
| Second Generation | 13.6 | 2.2 | |||
| Third Generation or more | 14.4 | 1.7 | |||
| Strategic Planning | First Generation | 12.8 | 2.3 | 4.89 | 0.009 |
| Second Generation | 13.3 | 2.1 | |||
| Third Generation or more | 14.1 | 1.8 | |||
| Sustainability | First Generation | 12.7 | 2.5 | 6.02 | 0.003 |
| Second Generation | 13.5 | 2.3 | |||
| Third Generation or more | 14.3 | 1.6 |
| Sector | Innovation (Mean) | Sustainability (Mean) |
|---|---|---|
| Agriculture | 12.1 | 12.7 |
| Manufacturing | 13.9 | 13.8 |
| Services | 13.0 | 13.2 |
| Retail | 12.5 | 12.9 |
| Automobile | 14.2 | 14.1 |
This study provides strong support for the proposed hypotheses, demonstrating the significant influence of generational stages and strategic practices on sustainability in family-owned businesses. Findings confirm that generational stages significantly impact the adoption of strategic practices. Earlier generations often prioritize traditional approaches, limiting sustainability integration. However, later generations demonstrate greater openness to innovation and strategic planning, aligning with contemporary business trends.
The study also confirms the crucial role of strategic practices in driving sustainability. Strong positive correlations were found between sustainability and CI, agility, innovation, and strategic planning. Strategic planning exhibited the strongest relationship with sustainability (r=0.525), emphasizing its crucial role in aligning operations with broader sustainability objectives (Mintzberg, 1994). Furthermore, generational ownership moderates the relationship between strategic planning and sustainability. Third-generation businesses demonstrate higher scores in strategic planning and innovation, with the automobile sector leading all indicators at Innovation: 14.2 and Sustainability: 14.1.
This study demonstrates that generational maturity significantly influences the sustainability of Nigerian family-owned businesses. Later-generation businesses exhibit enhanced strategic capabilities, including innovation, agility, and particularly strategic planning. These findings highlight the crucial role of strategic planning in aligning short-term goals with long-term sustainability objectives. Sectoral differences were observed, with businesses in high-pressure industries exhibiting stronger innovation and sustainability practices.
This study recommends several key strategies for Nigerian family-owned businesses: (1) Prioritizing the development of formal strategic planning processes, especially for first- and second-generation firms; (2) Fostering a culture of innovation and agility to adapt to market disruptions; (3) Investing in intergenerational knowledge transfer to preserve the wisdom of founders while incorporating fresh perspectives; (4) Businesses in sectors like manufacturing and automobiles should continue to invest in innovation and sustainability practices; (5) Investing in leadership development programs to equip younger generations with necessary skills to navigate the complexities of the modern business environment.
- Barney, J. (1991). Firm resources and sustained competitive advantage. Journal of Management, 17(1), 99–120.
- Chrisman, J. J., Chua, J. H., & Sharma, P. (2005). Trends and directions in the development of a strategic management theory of the family firm. Entrepreneurship Theory and Practice, 29(5), 555–575.
- Dibrell, C., Craig, J. B., & Neubaum, D. O. (2014). Linking the formal strategic planning process, planning flexibility, and innovativeness to firm performance. Journal of Business Research, 67(9), 2000–2007.
- Doz, Y. L., & Kosonen, M. (2010). Embedding strategic agility. Long Range Planning, 43(2–3), 370–382.
- Lumpkin, G. T., & Brigham, K. H. (2011). Long-term orientation and intertemporal choice in family firms. Entrepreneurship Theory and Practice, 35(6), 1149–1169.
- Marcus, B., & Madukwe, E. P. (2023). Familypreneurship in Nigeria. International Journal of Research and Scientific Innovation, X(IX), 323–334.
- Mintzberg, H. (1994). The rise and fall of strategic planning. Simon and Schuster.
- Nordqvist, M., & Zellweger, T. M. (2010). Transgenerational entrepreneurship. Edward Elgar Publishing.
- Olaleye, B. R., et al. (2024). Leveraging innovation capability and organizational resilience for business sustainability. Sustainability, 16(21), 9201.
- Omoyele, O. S., et al. (2023). Business model innovation as a catalyst for sustainable entrepreneurship. Skyline Business Journal.
- Teece, D. J., Pisano, G., & Shuen, A. (1997). Dynamic capabilities and strategic management. Strategic Management Journal, 18(7), 509–533.
- Ukaegbu, C. C. (2003). Entrepreneurial succession and post-founder durability. Journal of African Business, 4(1), 35–53.
In developed economies, sustainability reporting is integrated into corporate strategies, with firms leveraging it to gain a competitive advantage. Research suggests that companies with strong sustainability disclosures tend to exhibit higher financial performance, lower capital costs, and improved stakeholder relations. A study by Khan, Serafeim, and Yoon (2016) found that firms with material sustainability practices outperformed their counterparts in terms of stock returns and profitability. However, the adoption and impact of sustainability reporting in emerging economies, particularly in sectors such as agriculture and natural resources, remain underexplored.
In Nigeria, sustainability reporting remains in its early stages, with many listed firms gradually adopting global sustainability standards. However, limited research exists on how sustainability reporting affects firm value in Nigeria's agricultural and natural resources sector. Given the sector's contribution to Nigeria's GDP and its susceptibility to environmental and social risks, understanding the role of sustainability reporting in shaping firm value is critical (Olayemi, 2021). The regulatory framework guiding sustainability reporting in Nigeria is still evolving. The Financial Reporting Council of Nigeria (FRCN) and the Securities and Exchange Commission (SEC) have made efforts to promote sustainability disclosure through guidelines aligned with international standards such as the Global Reporting Initiative (GRI) and International Financial Reporting Standards (IFRS). The Nigerian Stock Exchange (NSE), now NGX, launched its Sustainability Disclosure Guidelines in 2018, mandating listed companies to report their ESG performance to enhance corporate transparency and accountability. Despite these efforts, compliance remains low, and many firms only disclose sustainability-related information to fulfill regulatory requirements rather than as a strategic initiative for value creation.
This study seeks to address this gap by examining the impact of sustainability reporting on firm value among listed agriculture and natural resources firms in Nigeria. Specifically, it explores how sustainable environmental, social, and governance (ESG) disclosures influence firm value, measured by Earnings Per Share (EPS), while controlling for firm size.
Firm value is a critical concept in corporate finance and accounting, serving as a fundamental measure of a company's financial health, market performance, and long-term viability. According to Saheed, Kayode, and Abdulkadri (2023), firm value is the total worth of a business, often measured through financial metrics such as market capitalization, enterprise value, and intrinsic valuation models. Firm value encompasses both tangible and intangible assets, including future cash flows, brand reputation, and competitive positioning. The connection between sustainability reporting and firm value has attracted significant interest. Evidence suggests that transparent sustainability practices can boost a company's reputation and, consequently, its firm value.
Sustainability reporting has gained significant attention in both academic literature and corporate practice, particularly in emerging economies. According to the Global Reporting Initiative (GRI), sustainability reporting refers to "the practice of measuring, disclosing, and being accountable to internal and external stakeholders for organizational performance towards the goal of sustainable development." Similarly, the International Integrated Reporting Council (IIRC) defines it as "a process founded on integrated thinking that results in a periodic report by an organization about value creation over time."
Stakeholder Theory was first introduced by Edward R. Freeman in 1984. Freeman argued that firms do not operate in isolation but exist within a network of relationships that include investors, employees, customers, suppliers, government agencies, and society at large. Unlike the traditional Shareholder Theory, which prioritizes profit maximization for shareholders, Stakeholder Theory advocates for a more inclusive approach, suggesting that firms should create value for all stakeholders to ensure long-term sustainability. The theory is particularly relevant to sustainability reporting in emerging economies because firms in sectors such as agriculture and natural resources significantly impact multiple stakeholder groups, including local communities, environmental activists, and policymakers. Given the environmental risks and social concerns associated with these industries, transparent sustainability reporting is essential for building trust and enhancing firm value.
This study employs an ex post facto research design, which is appropriate for investigating cause-and-effect relationships using archival data. The population for this study comprises all the listed Agricultural and Natural Resources firms on the Nigerian Stock Exchange (NGX). Due to the manageable size of the population, the study adopts a census sampling approach. Specifically, the total sample consists of all listed firms in the relevant sectors on the NGX, which includes 4 Agricultural firms and 4 Natural Resources firms, making a total of 8 firms (88 panel observations over 11 years). Data were collected from Annual Reports and Financial Statements and NGX and Public Databases.
Model specification: EPSit = β₀ + β₁SEDit + β₂SSDit + β₃SGDit + β₄FSit + εit. Where: EPSit = Earnings Per Share of firm i at time t; SEDit, SSDit, SGDit = environmental, social, and governance disclosure indices; FSit = firm size (control variable) = log of total assets; β₀ = intercept; εit = error term.
Earnings Per Share (EPS), the dependent variable, ranges from –0.13 to 8.80 Naira, with a mean of approximately 1.60 Naira. The relatively high standard deviation of 2.10 indicates considerable dispersion around the mean. Sustainable Environmental Disclosure (SED) is measured on a scale from 0% to 100%, with a mean of 46.31% and a large standard deviation of 44.94%. Sustainable Social Disclosure (SSD) shows a minimum of 0% and a maximum of 100%, with a mean of 51.14% and a standard deviation of 44.19%. Sustainable Governance Disclosure (SGD), also measured from 0% to 100%, has a mean of 57.95% and a standard deviation of 43.47%. Firm Size (FS) ranges from 2.370 to 4.756, with a mean of 3.51 and a standard deviation of 0.63.
| EPS (Naira) | SED | SSD | SGD | FS | |
|---|---|---|---|---|---|
| Minimum | –0.13 | 0% | 0% | 0% | 2.370 |
| Maximum | 8.80 | 100% | 100% | 100% | 4.756 |
| Mean | 1.5999 | 46.31% | 51.14% | 57.95% | 3.51039 |
| Std. Deviation | 2.09642 | 44.936% | 44.190% | 43.474% | 0.627354 |
| Skewness | 1.648 | .129 | –.045 | –.318 | .341 |
| Kurtosis | 1.824 | –1.809 | –1.794 | –1.679 | –.708 |
The correlation coefficient between SED and EPS is 0.442 (p = 0.000), indicating a moderately strong positive relationship. The correlation between SSD and EPS is 0.325 (p = 0.002), positive and statistically significant at the 1% level. The correlation between SGD and EPS is 0.239 (p = 0.025), significant at the 5% level. There are also strong interrelationships among the three sustainability disclosure measures: SSD-SGD correlation of 0.956 (nearly perfect), SED-SSD at 0.813, and SED-SGD at 0.758. Firm Size correlates strongly with EPS (r = 0.836, p < 0.001), suggesting that larger firms tend to have significantly higher earnings per share.
| EPS | SED | SSD | SGD | FS | |
|---|---|---|---|---|---|
| EPS | 1 | .442** | .325** | .239* | .836** |
| SED | .442** | 1 | .813** | .758** | .578** |
| SSD | .325** | .813** | 1 | .956** | .316** |
| SGD | .239* | .758** | .956** | 1 | .266* |
| FS | .836** | .578** | .316** | .266* | 1 |
| R | R Square | Adjusted R Square | Std. Error | Durbin-Watson |
|---|---|---|---|---|
| .870 | .757 | .746 | 1.05714 | .291 |
| Model | B | Std. Error | Beta | t | Sig. |
|---|---|---|---|---|---|
| (Constant) | –9.074 | .790 | –11.490 | .000 | |
| SED | –.018 | .005 | –.387 | –3.390 | .001 |
| SSD | .040 | .010 | .848 | 4.064 | .000 |
| SGD | –.025 | .009 | –.527 | –2.824 | .006 |
| FS | 3.112 | .235 | .931 | 13.257 | .000 |
The R = 0.870 represents a strong positive relationship between the independent variables and EPS. The R² = 0.757 suggests that 75.7% of the variation in EPS is explained by the independent variables. The high F-value (64.786) and significant p-value (p < 0.01) indicate that the overall regression model is statistically significant. Firm Size has the largest positive impact on EPS (β=0.931; t=13.257), suggesting that larger firms tend to have significantly higher earnings per share due to economies of scale and better financial management. Sustainable Environmental Disclosure (SED) shows a negative coefficient (β=–0.387; p=0.001), indicating that increased environmental disclosures are associated with a slight decrease in EPS, possibly due to the high initial costs of implementing environmental policies. The positive coefficient of Sustainable Social Disclosure (SSD) (β=0.848; p=0.000) suggests that social disclosures significantly improve EPS through improved stakeholder trust and brand loyalty. Sustainable Governance Disclosure (SGD) (β=–0.527; p=0.006) shows a negative relationship, potentially due to increased transparency requirements leading to higher compliance costs.
This study concludes that sustainability reporting enhances firm value in emerging economies, particularly in the listed agriculture and natural resources sectors in Nigeria. Based on these findings, three recommendations are proposed: (1) Firms in the agriculture and natural resources sectors should prioritize and further invest in sustainable social disclosure. By improving transparency in areas such as employee welfare, community development, and ethical practices, companies can build stronger stakeholder trust, leading to enhanced investor confidence and improved market performance. (2) Although environmental and governance disclosures are critical, their current negative impact on EPS suggests the need for more cost-effective and strategic reporting methods. Firms should consider streamlining their reporting processes and implementing efficiency measures to minimize compliance costs without compromising the quality and comprehensiveness of the information disclosed. (3) Policymakers and regulatory bodies in Nigeria should develop tailored guidelines that support sustainability reporting in emerging economies. By establishing frameworks that balance transparency with financial viability, regulators can help firms mitigate the short-term costs associated with environmental and governance disclosures, thereby promoting sustainable business practices that drive long-term firm value.
- Abiola, B. I., et al. (2024). Sustainability Reporting and Firm Value: Empirical Evidence from Nigeria. International Journal of Advances in Engineering and Management, 6(05), 282–290.
- Adams, C. A. (2004). The ethical, social and environmental reporting-performance portrayal gap. Accounting, Auditing & Accountability Journal, 17(5), 731–757.
- Adegbite, E., Amaeshi, K., & Nakpodia, F. (2019). Corporate social responsibility in Nigeria. Corporate Governance: The International Journal of Business in Society, 19(3), 501–526.
- Belal, A. R., & Owen, D. L. (2015). The rise and fall of stand-alone social reporting. Accounting, Auditing & Accountability Journal, 28(7), 1160–1192.
- Eccles, R. G., & Serafeim, G. (2013). The performance frontier: Innovating for a sustainable strategy. Harvard Business Review, 91(5), 50–60.
- Eccles, R. G., Ioannou, I., & Serafeim, G. (2014). The impact of corporate sustainability on organizational processes and performance. Management Science, 60(11), 2835–2857.
- Freeman, R. E. (1984). Strategic Management: A Stakeholder Approach. Pitman Publishing.
- García-Sánchez, I. M., Martínez-Ferrero, J., & Rodríguez-Ariza, L. (2016). Corporate governance and corporate social responsibility. Journal of Economic Surveys, 30(2), 141–160.
- GRI. (2021). GRI Standards. Global Reporting Initiative.
- Khan, M., Serafeim, G., & Yoon, A. (2016). Corporate sustainability: First evidence on materiality. The Accounting Review, 91(6), 1697–1724.
- Koller, T., Goedhart, M., & Wessels, D. (2020). Valuation: Measuring and managing the value of companies. John Wiley & Sons.
- Michelon, G., Pilonato, S., & Ricceri, F. (2015). Sustainability disclosure and financial performance. Sustainability Accounting, Management and Policy Journal, 6(1), 2–21.
- Nagat, M. M. Y. (2023). Sustainability reports and their impact on firm value: Evidence from Saudi Arabia. International Journal of Management and Sustainability, 12(2), 70–83.
- Owolabi, S. A., & Ajibade, B. J. (2022). Corporate sustainability practices and firm value in Nigeria. Journal of Financial Studies, 14(3), 134–151.
- Saheed, O. I., Kayode, I. A., & Abdulkadri, T. A. (2023). The role of corporate sustainability disclosure in promoting firm value of listed manufacturing firms in Nigeria. Proceedings of the 7th Annual International Academic Conference on Accounting and Finance.
- Shaban, O. S., & Zarnoun, R. S. (2024). Impact of sustainability reporting on financial performance and risks. Risk Governance and Control: Financial Markets & Institutions, 14(4), 96–109.
- Uwuigbe, O., Egbide, B., & Ayokunle, A. (2020). Sustainability reporting and financial performance. Journal of Sustainable Finance & Investment, 10(2), 211–231.
olatundun.oderinde@oouagoiwoye.edu.ng
Cultural practices and traditions often play a significant role in defining individual and collective identities, providing a sense of belonging and shared heritage among members of a community. Culture influences social norms and values, dictating acceptable behavior within a society and shaping interpersonal relationships. They serve as guidelines for how individuals should behave in different social settings and help maintain social order and cohesion. Promotion of cultural identity contributes to societal stability, unity, and resilience especially in Nigeria, a nation marked by immense ethnic and cultural diversity, with each of the groups endowed with several unique cultural endowments as reflected in the National anthem, "…though tribe and tongue may differ, in brotherhood we stand…"
Culture refers to an integrated system of beliefs (about God or reality or ultimate meaning), of values (about what is true, good, beautiful and normative), of customs (how to behave, relate to others, talk, pray, dress, work, play, trade, farm, eat etc), and of institutions which express these beliefs, values, and customs (government, law courts, temples or churches, family, schools, hospitals, unions etc), which binds a society together and gives it a sense of identity, dignity, security and continuity (Oderinde, 2013). Culture is how human beings develop their knowledge and their attitudes towards life. The World Bank (2006) affirms that physical cultural resources are important as sources of valuable scientific and historical information, as assets for economic and social development, and as integral parts of a people's cultural identity and practices. Culture can be used as a stabilizing agent and an effective tool for arresting the tide of poverty, unemployment and misery; it can also be used to entrench progressive human development, enhance creativity and increase productivity for the common good, which in essence is what sustainable development is all about.
Cultural heritage is the legacy of tangible and intangible assets inherited from past generations, preserved in the present, and passed on to future generations (Nomishan, and Sani, 2023). Cultural heritage can be seen as an expression of the ways of living which is developed by communities which is in turn transferred from one generation to another generation including customs, practices, places, objects, artistic expressions and values (ICOMOS, 2024). Cultural heritage represents the identity and collective memory of a community, serving as a vital link between the past, present, and future.
In Nigeria, cultural heritage holds immense significance due to the country's rich diversity, which includes over 250 ethnic groups and an array of languages, traditions, and practices. It reflects the unique identities and shared histories of these communities while contributing to a sense of belonging and national unity. Additionally, Nigeria's cultural heritage serves as a resource for education, tourism, and economic development, offering opportunities for employment and international recognition. Cultural heritage promotes sustainable development, encouraging responsible use of natural resources and preservation of traditional practices. It is pertinent for stakeholders to take cognizance of the intricacies between cultural security and sustainable development because without social cohesion and a friendly environment which culture promotes, development projects cannot subsist.
According to the Nigerian Ministry of Foreign Affairs (2024), the Nigerian government launched the National Cultural Policy in September 1988. This policy defined culture as the complete way of life developed by a group of people as they adapt to the challenges of their environment. It provides structure and significance to their social, political, economic, aesthetic, and religious practices, as well as their organizational methods, thereby distinguishing them from their neighbors. The Federal Government established the Federal Ministry of Culture and Tourism in June 1999, and by mid-2006, it was renamed the Federal Ministry of Tourism, Culture, and National Orientation. In 2015, the Ministry of Culture and Tourism merged with the Ministry of Information, forming the Ministry of Information, Culture, and Tourism.
Nigeria's cultural heritage is broadly categorized into two key elements: tangible heritage and intangible heritage. Intangible cultural heritage refers to the expressions, practices, knowledge, skills, and the tools, objects, artifacts, and cultural spaces linked to them, that communities, groups, and sometimes individuals identify as part of their cultural legacy. As stated by UNESCO (2019), intangible cultural heritage is contemporary, traditional, and living at the same time; as well as inclusive; representative; and community based. In Nigeria, the tangible cultural heritage reflects the rich histories and identities of the diverse ethnic groups, showcasing a blend of ancient traditions, craftsmanship, and architectural ingenuity. Nigeria is home to UNESCO World Heritage Sites such as the Sukur Cultural Landscape in Adamawa State and the Osun-Osogbo Sacred Grove in Osun State. Other notable sites include the ancient walls of Kano, the Benin Moat, and various colonial-era architectural landmarks. The Ife Kingdom produced lifelike brass and terracotta sculptures, reflecting the kingdom's artistic sophistication and spiritual significance, while dating back to the 9th century, Igbo Ukwu bronzes and other artifacts reveal the advanced metallurgical skills of the Igbo people.
Other tangible cultural heritage includes the traditional architecture of the Zuma Rock in Niger state, ancient royal palaces, traditional mosques like the Zaria Mosque and the Gidan Makama Museum, which display unique Hausa architectural styles. Furthermore, there are religious sites such as the sacred Osun Osogbo grove, and slave trade relics in Badagry as well as other museums holding Nigeria's precious artefacts. These heritages reinforce the unique identities of Nigeria's ethnic groups, fostering pride and unity, attracting tourism, providing revenue and employment opportunities for local communities, serve as tools for learning and understanding Nigeria's rich history and strengthen Nigeria's place on the global stage, showcasing its contributions to human civilization.
The Nigerian culture with its high moral standard is gradually collapsing and affecting nation building. Some of the cherished moral values in Nigerian societies such as hospitality, politeness, kindness, generosity, honesty are far declining. There has been a breakdown in these moral values and norms in Nigeria as various crimes, dishonesty, greed and ignorance have become prevalent in the society. Preserving Nigeria's tangible cultural heritage is essential for maintaining the nation's historical legacy and ensuring that future generations can connect with their past. However, the preservation of Nigerian cultural heritage faces threats from human activities, natural forces, and biological and chemical agents. One of the most significant destructive human actions against Nigerian cultural heritage took place during the punitive expedition of 1897, when the British colonials attacked the Benin culture area, looted the royal palace's valuable bronze works and art treasures, and exiled the King to Calabar, where he eventually died in 1914. In similar vein, the current condition of Nigeria's indigenous linguistic heritage is best described as endangered, with many languages on the brink of extinction because of the enforcement of English language as the lingua franca and introduction of foreign literatures.
In the entertainment sector, traditional roles such as poets, praise-singers, clowns, comedians, and dramatists in royal courts, along with indigenous dances, songs, costumes, and musical instruments like drums, were gradually replaced by Western influences. "Nigerian youths are rapidly losing touch with cultural values, and this could be seen in the alien culture which they portray; their bizarre dressing, dancing, language and so on which invariably affect other aspects of social life" (Oni, 2018, 2). The challenges facing the preservation of Nigeria's cultural heritage are many, spanning from communal and ethnic conflicts to religious fundamentalism, which includes the intentional burning and destruction of monuments, shrines, and sacred sites deemed offensive or heretical by the adherents of resurgent religions. All this falls short of the noble intent and overarching goal of sustainable development.
Sustainable Development has to do with the development that meets the needs of the present and does not compromise the ability of future generations to meet theirs (Cerin, 2006; Dernbach, 2003). In principle, sustainable development integrates environmental, social, and economic concerns into all aspects of decision making. Sustainable development seeks to balance the economic, environmental, and social dimensions of development in a long-term and global perspective. A broad view of human welfare, and also, a long-term perspective about the consequences of today's activities is implied in the concept. It also includes the full involvement of civil society to reach viable solutions to human predicaments. In its goal, sustainable development embodies a global policy framework intending to bring about the eradication of poverty in all forms, environmental preservation, combat inequality, and ensure prosperity and peace. While protecting the long-term value of the social and physical environment, sustainable development aims to maintain economic advancement and progress. As such, sustainable development projects do not destroy people's social life but enhance it through conscious preservation of their cultural heritages.
Sustainable development becomes feasible only when development projects are culturally sensitive. Emphasizing culture means giving members of the community an actual role in directing their own destinies, restoring the agency for change to those whom the development efforts are intended to impact, which is crucial to sustainable development. All stakeholders need to ensure projects align with the values and priorities of the local communities. Large-scale infrastructure projects, urbanization, introduction of new technologies and designs must be done in such a way that minimize destruction of cultural heritage and environmental natural resources.
Decline in the use of indigenous languages in preference for English language has eroded the transmission of cultural knowledge and values embedded in the local languages. It disrupts the cultural heritage of communal living and shared responsibilities while promoting nuclear family setups in cities, all in the name of globalization, thus reducing the influence of elders and traditional values on the younger generation. This certainly has negative implications for sustainable development in Nigeria. The younger generation has less interest in indigenous belief systems and practices, such as Yoruba Ifa divination and Igbo traditional worship which helped to curb acts of irresponsibility, criminality, insubordination, and corruption before globalization.
Government needs to develop and implement deliberate policies to preserve Nigeria's rich cultural heritage and cultural identity, ensuring it coexists with modernization, to have sustainable development. Globalization has brought about a dual impact. While it has opened doors for international recognition and celebration of Nigerian culture, it has also posed substantial threats to the preservation of traditional values and practices. Cultural impact assessments should become standard components of any major development project — not as bureaucratic add-ons, but as genuine frameworks for ensuring that economic progress enhances rather than erodes the human fabric of communities.
- Ajayi, O. O., & Adediran, Y. O. (2024). Globalization and Its Effects on Nigerian Culture. Islamic University Journal of Social Sciences, 3(2).
- Ahmad, Y. (2006). The Scope and Definitions of Heritage: From Tangible to Intangible. International Journal of Heritage Studies, 12(3), 292–300.
- Carbone, F. (2016). An insight into cultural heritage management of tourism destinations. European Journal of Tourism Research, 14, 75–91.
- Daniel, C. O. (2014). Impact of Globalization on Socio-Cultural Development in Nigeria. Developing Country Studies, 4(17), 31–41.
- Deekor, L. N., & Maekae, J. (2015). Culture and Cultural Diversity in Sustainable Development: The Nigerian Experience. Journal of Economics and Sustainable Development, 6(13), 251–262.
- Eluyemi, O. (2002). The Preservation of Nigerian Cultural Heritage: Challenges & Prospects. Fourth Bassey Wai Andah Memorial Lecture. Ibadan: Textflow.
- ICOMOS International Cultural Tourism Committee. (2002). Principles and Guidelines for Managing Tourism at Places of Cultural and Heritage Significance.
- Madandola, M., & Boussaa, D. (2023). Cultural heritage tourism as a catalyst for sustainable development. Journal of Heritage Tourism.
- Nomishan, T., & Sani, A. (2023). Intangible Cultural Heritage Protection and Nigeria's Heritage Legislation. Santander Art and Culture Law Review, 2(9), 293–320.
- Nomishan, T., Tubi, P., & Gubam, D. (2023). Cultural Heritage Management and the Effect of Corruption in Nigeria. Journal of Cultural Heritage Management and Sustainable Development, 13(4), 662–684.
- Oderinde, O. A. (2013). The Basics of Contextual Theology. Ibadan, Nigeria: Korem Prints.
- Ogundele, S. O. (2014). Understanding Contemporary Archaeology. Ibadan: John Archers Publishers.
- Oni, A. (2018). Globalisation and its Implication on African Culture and Development. International Journal of African and African American Studies, 4(2), 60–71.
- Onyima, B. N. (2016). Nigerian cultural heritage: preservation, challenges and prospects. Ogirisi: A New Journal of African Studies, 12, 274.
- Shyllon, F. (2007). Cultural Heritage Legislation and Management in Nigeria. International Journal of Cultural Property, 5(2).
- UNESCO. (2019). Fighting illicit trafficking in cultural property. UNESCO.
- World Bank. (2006). Operational Policy 4.11, Physical Cultural Resources. World Bank.
2,3 Romanian-American University, Bucharest, Romania — serbangeorgescu@csrj.ro
4 Universitat Ramon Llull (IQS), Barcelona, Spain — horacio.rostro@iqs.url.edu
The global automotive industry is undergoing a profound transformation driven by technological disruption, decarbonization imperatives, and shifting consumer preferences. Electrification, connectivity, autonomous driving, and shared mobility are redefining the competitive landscape. In 2024, global electric vehicle (EV) sales exceeded 14 million units, led by China, Europe, and the United States (IEA, 2025). Automakers are responding with aggressive investments in digital technologies, battery innovation, and sustainability strategies aligned with ESG goals and the UN Sustainable Development Goals (SDGs).
Regionally, North America remains a powerhouse for automotive innovation and production. The United States continues to lead in research and development, while Canada and Mexico offer cost-efficient, skilled manufacturing. Mexico, in particular, serves as a critical link in North American supply chains. With over 3.4 million vehicles exported in 2024, Mexico is among the top vehicle producers globally (INEGI, 2025). The country's competitiveness stems from its strategic geography, trade liberalization through NAFTA/USMCA, robust industrial clusters, and an increasing commitment to sustainable manufacturing.
This paper conducts a strategic analysis of seven major automotive firms operating in Mexico — General Motors, Nissan, Ford, Stellantis, Volkswagen, Toyota, Honda — and Tesla, which plans to open a plant in the country in the near future, with an emphasis on engineering innovation, international business strategies, and alignment with SDG 9 (Industry, Innovation and Infrastructure) and SDG 13 (Climate Action). Through qualitative methods, this study examines how these firms balance profitability, environmental responsibility, and technological advancement in Mexico's dynamic industrial environment.
Automakers increasingly form global partnerships to share risk, combine competencies, and enter new markets. Large OEMs co-develop technology with suppliers or launch joint ventures in target regions to access local expertise and scale. Silva, Kaminski, and Marin (2021) find that while car companies run joint projects with suppliers, they often remain relatively closed to broader ecosystems, requiring stronger government incentives to evolve. Tidd (2023) emphasizes that for innovation to succeed, it must be strategically managed across technology, market, and organizational dimensions.
Mexico's automotive industry represents a cornerstone of the national economy and a key pillar of global vehicle supply chains. Since the 1990s, the country has developed into a global manufacturing hub, benefitting from liberalized trade policies — notably NAFTA and now USMCA — as well as strong bilateral investment treaties. Regions such as Guanajuato, Puebla, Aguascalientes, and Nuevo León have become critical nodes for advanced manufacturing, supported by vocational education systems and university-industry collaborations (Mendoza-Mendoza et al., 2022). Sustainability has emerged as a competitive priority, with firms under mounting pressure from regulators, investors, and civil society to decarbonize operations and embed ESG principles.
Sustainability is reshaping strategy across the global automotive sector. Automakers are incorporating circular economy (CE) principles and Industry 4.0 technologies to improve both environmental and economic performance. Zhang, Khan, and Umar (2021) find that CE practices and digital technologies together lead to operational improvements and higher firm performance. Acciarini et al. (2021) further emphasize that sustainability and digitalization reinforce one another — automotive companies that adopted digital strategies also tended to pursue green initiatives like electric vehicles and renewable energy.
Trade policy, environmental regulation, and industrial policy all exert significant influence on automotive business strategy. Trade agreements like NAFTA/USMCA have enabled the U.S., Mexico, and Canada to build integrated automotive supply chains and become major exporters. In Europe, Szabó and Newell (2024) argue that the transition to electric vehicles is being driven by environmental justice goals, though core economies retain high-value segments of EV production. Global uncertainties — geopolitical tensions, semiconductor shortages, and shifts in trade and environmental regulations — highlight the need for adaptive business strategies.
This research adopts a qualitative comparative case study design, employing four interlinked strategic tools to assess each company's current position and future trajectory in Mexico: (1) SWOT Analysis — identifies internal strengths and weaknesses, as well as external opportunities and threats; (2) PESTEL Analysis — provides a macro-environmental review of Mexico's political, economic, social, technological, environmental, and legal factors impacting the automotive industry; (3) Porter's Diamond Model — evaluates the competitive advantage of Mexico as a manufacturing base using factor conditions, demand conditions, related and supporting industries, and firm strategy, structure, and rivalry; (4) SDG Alignment Matrix — constructs a matrix mapping firm-level strategies, initiatives, and outcomes against the indicators of SDG 9 and SDG 13. Data was collected from 2024 company sustainability and annual reports, press releases, government publications, and secondary literature.
| Company | Strengths | Weaknesses | Opportunities | Threats |
|---|---|---|---|---|
| GM | Strong USMCA supply chains | Aging vehicle platforms | EV transition via Ultium platform | U.S. policy uncertainty |
| Nissan | Deep local supplier integration | Limited EV exports | Smart mobility tech | Global EV competition |
| Ford | Advanced EV production in Mexico | Relatively low volume | EV growth, Mustang Mach-E | Battery sourcing risks |
| Stellantis | Brand diversity | Complex operations | Modular EV platforms | Regional regulatory fragmentation |
| VW | Strong R&D in Puebla | Late EV transition | ID-series platform localization | German policy shifts |
| Toyota | Reputation for quality & hybrids | Conservative EV rollout | Expand hybrid offerings | Stricter emission norms |
| Honda | Flexible production capabilities | Smaller volume footprint | Fuel efficiency, compact EVs | FX volatility, lower economies of scale |
| Tesla | Fully electric; high automation | Project not operational yet | Smart factory and clean slate design | Political and infrastructure delays |
| Factor | Observations |
|---|---|
| Political | Pro-EV federal initiatives; policy volatility due to 2024 elections |
| Economic | Competitive labor costs, currency volatility, nearshoring incentives |
| Social | Young skilled workforce; growing middle-class demand for clean vehicles |
| Technological | Rise of AI and Industry 4.0 applications; EV infrastructure expansion |
| Environmental | Pressures from international accords; water scarcity challenges |
| Legal | Labor rights enforcement via USMCA; evolving emission standards |
Factor Conditions: Availability of skilled labor, cost-effective manufacturing, strong logistics infrastructure. Demand Conditions: U.S. market proximity, rising domestic demand for fuel-efficient vehicles. Related and Supporting Industries: Expanding supplier networks, EV component development. Firm Strategy, Structure and Rivalry: Intense competition drives innovation; strategic public-private partnerships.
| Company | SDG 9: Innovation & Infrastructure | SDG 13: Climate Action |
|---|---|---|
| GM | AI logistics, EV platforms | 2040 carbon neutrality goals |
| Nissan | Automation, lean manufacturing | Energy-saving manufacturing practices |
| Ford | EV hub in Cuautitlán | Zero-emission Mustang Mach-E |
| Stellantis | STLA modular EV platforms | Global decarbonization roadmap |
| VW | Localized EV R&D | EV platform transition (ID.4, etc.) |
| Toyota | Supplier innovation programs | Hybrid tech expansion |
| Honda | Compact production lines | Carbon neutrality goal by 2050 |
| Tesla | Fully automated production design | Entirely electric model portfolio |
The findings indicate that while all companies recognize the need for innovation and environmental responsibility, the level of commitment and implementation varies widely. Tesla represents a new paradigm with its fully electric approach, although delays in construction underscore the risks of greenfield investments. In contrast, legacy manufacturers like Nissan and GM leverage existing supply chains and infrastructure to implement gradual changes toward electrification and digitization.
Ford and Stellantis are actively expanding their EV offerings and using Mexico as a critical node in their North American strategies. VW has made significant R&D investments in Puebla, positioning itself to scale production of electric ID-series vehicles. Toyota and Honda remain cautious but consistent, using hybrids as a transitional technology. Overall, the Mexican context presents both enablers and constraints. Competitive manufacturing capabilities, trade access, and engineering talent offer significant advantages. However, infrastructure bottlenecks, policy inconsistency, and environmental stressors present long-term challenges.
This study investigated how leading multinational automotive manufacturers operating in Mexico integrate innovation, international strategy, and sustainability within their operations. The findings demonstrate that these firms, while heterogeneous in their strategic approaches, increasingly converge around shared priorities of decarbonization, digital transformation, and regional competitiveness. Mexico's competitive edge lies in its skilled labor force, geographic proximity to the United States, robust industrial clusters, and growing supplier ecosystems. These factor conditions are reinforced by domestic demand for low-emission vehicles and heightened global expectations for environmental performance.
Engineering innovation was found to be central to sustaining competitive advantage, particularly in the transition to electric mobility and smart manufacturing platforms. International business strategies — such as reinvestment in production capacity, strategic alliances, and vertical integration — also enable OEMs to respond flexibly to global disruptions and regulatory volatility. However, disparities remain in the depth of sustainability integration and the pace of innovation across firms. Institutional support and policy consistency will therefore be essential in aligning industrial practices with SDG benchmarks. The synergy between engineering innovation and international business strategy, framed within Mexico's evolving industrial ecosystem, serves as a catalyst for sustainable growth in the automotive sector.
- Acciarini, C., et al. (2021). Can Digitalization Favour the Emergence of Innovative and Sustainable Business Models? Journal of Strategy and Management. https://doi.org/10.1108/JSMA-02-2021-0033
- Barajas, R., & Moreno-Brid, J. C. (2021). The USMCA and Mexico's Development. Globalizations, 18(7), 1210–1227.
- Carreón-González, A., et al. (2022). Circular Economy Strategies and the Mexican Automotive Supply Chain. Journal of Cleaner Production, 364, 132615.
- Díaz-Reza, J. R., et al. (2023). Sustainability Performance Evaluation in the Automotive Industry. The TQM Journal, 35(9), 54–73.
- Ford Motor Company. (2024). 2024 Annual Integrated Sustainability and Financial Report.
- General Motors. (2023). 2023 Sustainability Report.
- González-Sánchez, R., & Aguilar-Barceló, J. G. (2023). Lean-Green Practices and Sustainability Indicators. Journal of Manufacturing Technology Management, 34(10), 1274–1293.
- Honda Motor Co. (2024). Honda ESG Databook 2024.
- IEA. (2025). More Than 1 in 4 Cars Sold Worldwide Is Set to Be Electric. https://www.iea.org
- INEGI. (2025). Registro Administrativo de la Industria Automotriz de Vehículos Ligeros.
- Llopis-Albert, C., Rubio, F., & Valero, F. (2020). Impact of Digital Transformation on the Automotive Industry. Technological Forecasting and Social Change, 162, 120343.
- López González, C., et al. (2022). Supply Chain Resilience in the Mexican Automotive Sector. Competitiveness Review, 32(3), 487–510.
- Mendoza-Mendoza, A., et al. (2022). Sustainable Innovation and Institutional Quality. Corporate Social Responsibility and Environmental Management, 29(6), 1736–1750.
- Nagy, M., & Lăzăroiu, G. (2022). Computer Vision Algorithms and Industry 4.0 in the Slovak Automotive Sector. Mathematics, 10(19), 3543.
- Nissan Motor Corporation. (2024). Sustainability Databook 2024.
- Stellantis. (2024). 2024 Expanded Sustainability Statement.
- Szabó, J., & Newell, P. (2024). Driving Towards a Just Transition? The Case of the European Car Industry. Energy Research & Social Science, 115, 103649.
- Tesla. (2023). Impact Report 2023.
- Tidd, J. (2023). Managing Innovation. In IEEE TEMS Body of Knowledge. John Wiley & Sons.
- Toyota Motor Corporation. (2024). Toyota Integrated Report 2024.
- Volkswagen AG. (2024). Annual Report 2024.
- Zhang, Y., Khan, S. A. R., & Umar, M. (2021). Circular Economy Practices and Industry 4.0 Technologies. Business Strategy and the Environment, 30(8), 2038–2060.
Future Research Agenda
The Editorial Board identifies the following frontier questions, aligned with the themes of the PSE International Conference on Innovation, Strategy & Sustainable Development in the Age of AI.
Why Publish with IJABER
- 01Institutional PrestigePublished by the Paris School of Entrepreneurship, an internationally recognized institution based in Paris, France — a global center for innovation, research, and entrepreneurship.
- 02Strategic Geographic FocusIJABER is explicitly designed to center research from and about emerging economies, particularly Africa — one of the few international journals with a mandate to prioritize these institutional contexts.
- 03Genuine InterdisciplinarityWe welcome submissions crossing disciplinary boundaries — combining finance with sociology, management with political economy, journalism with media economics, education with entrepreneurship.
- 04Conference IntegrationIJABER is formally associated with the PSE International Conference on Innovation, Strategy & Sustainable Development in the Age of AI (June 18–19, 2026, Paris). Conference presenters may submit work for journal consideration.
- 05Open Access ImpactPublished under CC BY 4.0 — every article is freely available to readers worldwide, no paywalls, maximizing reach and citation potential across academic and practitioner audiences globally.
Submission Guidelines
IJABER accepts submissions on a rolling basis in English or French. Submit manuscripts by email to the editorial office.
Policy Notes: 2,000–4,000 words · Expedited review
Case Studies: 4,000–8,000 words
Conference Papers (PSE 2026): 4,000–8,000 words · Priority review
• Font: Times New Roman, 12pt, double-spaced
• Abstract: 150–300 words
• Keywords: 5–8 terms
• JEL Classification codes required
• Referencing: APA 7th edition
• Remove all author details for blind review
2. Assignment to two reviewers (1 week)
3. Double-blind peer review (6–10 weeks)
4. Author notification
5. Revisions & re-review (if required)
6. Final acceptance & copyediting
7. Online-first publication (within 4 weeks)
• Conflict of interest disclosure
• Data availability statement
• Author contribution statement
• Plagiarism declaration (iThenticate screened)
• Adherence to COPE principles
• No simultaneous submission
Call for Papers — 2025–2026
IJABER invites original research submissions for the following thematic issues and the PSE International Conference 2026.
→ Full details & registration: parisschoolofentrepreneurship.com/conference
Contact the Editorial Office
Paris School of Entrepreneurship
10 Avenue Kléber, 75116 Paris, France
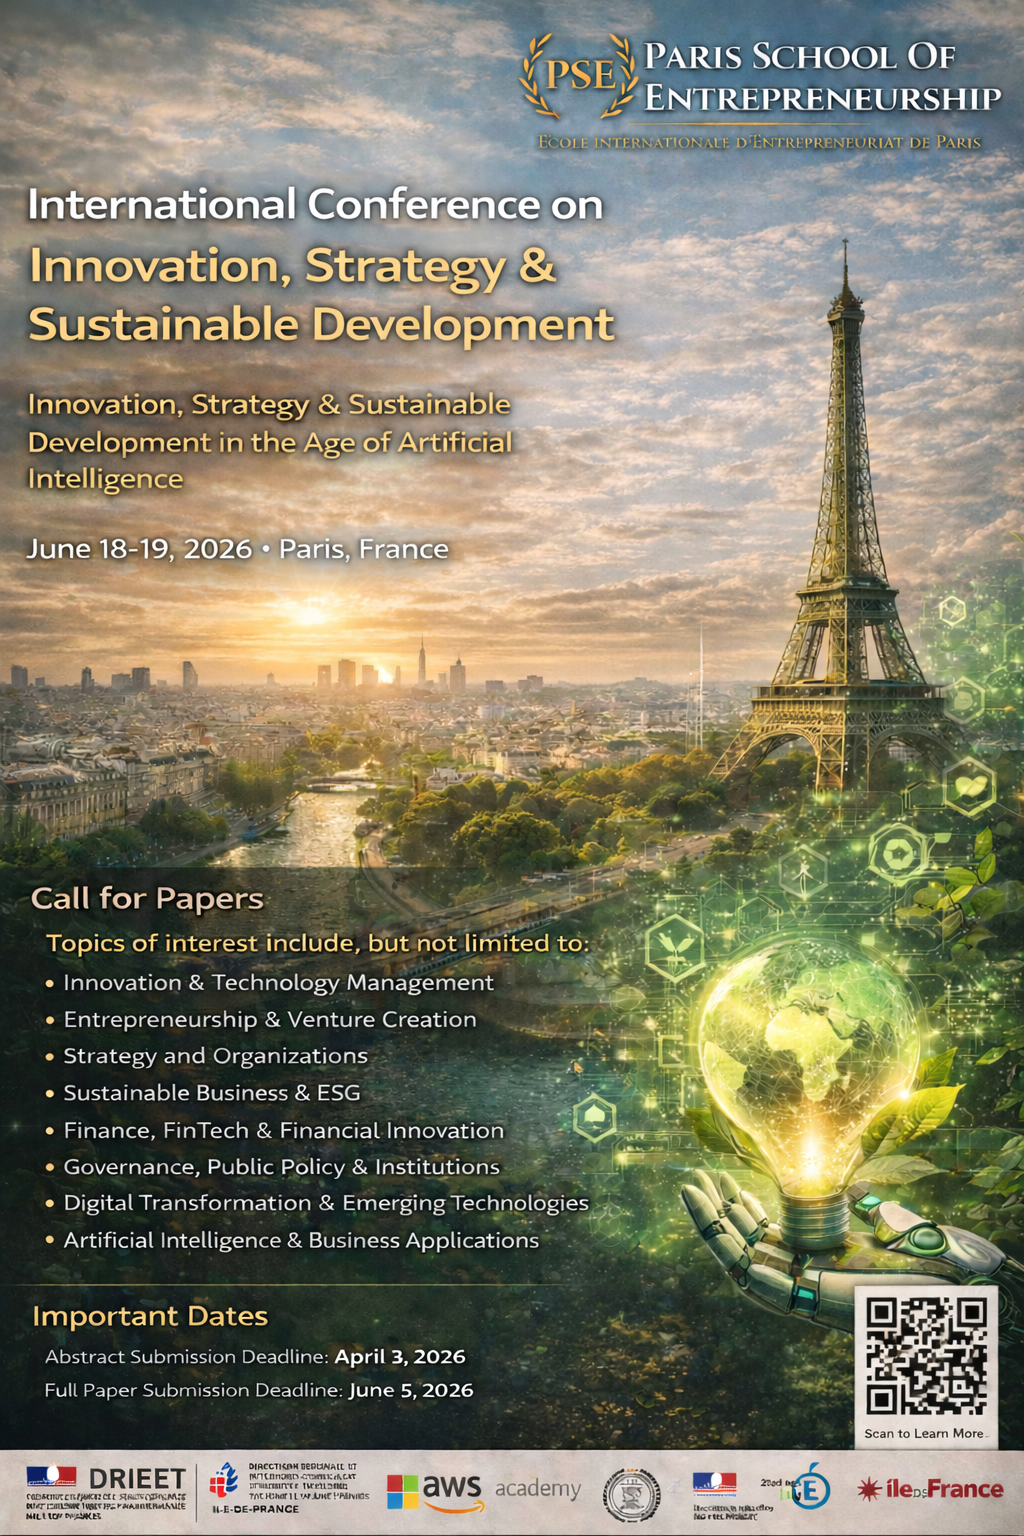
Don’t Miss Out On Our Next Conference!
Note: The next issue of the journal is scheduled for publication at the end of June 2026.